Statistics Quality
To make a Puzzle Cube I had to determine out of 30 cubes which 27 are the best to use , finding the 3 worse to use or outliers to not use.
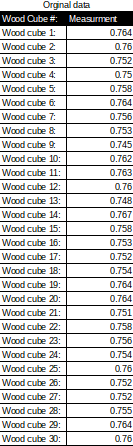
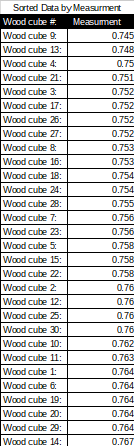
Using a Dial Caliper I measured 30 wooden cubes which I then sorted by measurement (inches).
|
|
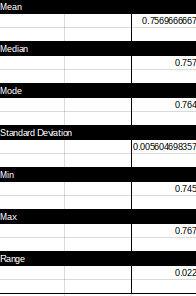
I then calculated the central tendencies, Standard deviation and other information regarding this Data (inches).
Histogram
Frequency of Wooden Cube Measurements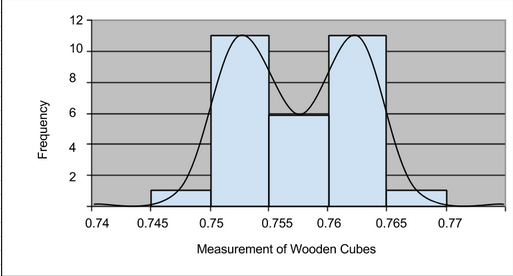
|
Bin and Frequencies within Bins

|
With the given Data I did not use Cube number 9 as it was to small and Cube number 14 as it was to large in comparison to the other cubes. I then choose to get rid of the last cube by random chance as everything else would had been tolerable.
