Applied Statistics
I created a histogram based upon the given information and also found the Standard Deviation of the proceeding:
Part of the manufacturing quality control testing for a toy is to measure the depth of a connector piece that must fit into another part. The designed depth is 4.1 cm. Every tenth part produced on the production line is measured. The following data was collected during a two minute production period.
4.1, 4.1, 4.0, 4.1, 3.9, 4.4, 3.9, 4.3, 4.0, 4.2, 4.0, 3.8
Standard Deviation
|
The first step I did towards finding the Standard Deviation was calculate the measures of central tendencies
Mean: {4.0666667 cm} Median: Answer = {4.1 cm} Mode: Answer ={ 4.0 ; 4.1cm} Range: 4.4-3.8 = 0.6 (answer: 0.6) |
Work: 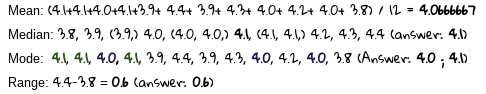
|
Proceeding calculating the measures of central tendencies I found the measures of variation in depth using by subtracting Average (4.0666667 cm) from the depth of each cube. Then once I had the value of variation I would square it, then once I had the squares for all the values of variations I added the values together.
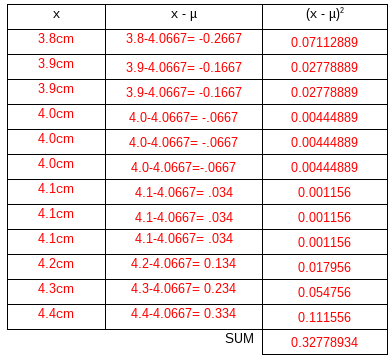
Once I had added the values together I then subtracted that sum by 12 (the quantity of cubes) to find the Standard deviation of the Data which is approximately 0.0273

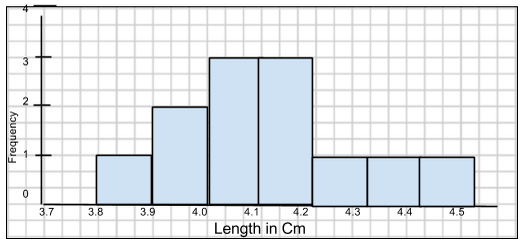
Histogram
Frequency of the Depth Length (in cm) for the Connector Piece